
Legend


Pop. density map [inh./km2] 1869
 |
>0 - 10 |  |
>10 - 30 |  |
>30 - 50 |  |
>50 - 100 |  |
>100 - 200 |  |
>200 - 500 |
Birth Seasonality of Vel'ké Pole
Birth rate in Velke Pole is affected by combination of factors such as the season (temperature and precipitation), sociological, religious, and economic practices. The chart belows displays similar fluctuations of birth over a 120-year period between 1781-1900, divided into 40-year epochs (Figures 1, 2 and 3). A general spring/summer trough is obvious and constant over almost all the epochs. However, it is evident that the high birth rate occurrence in the early months of the year (January, February and March) and last quarter of the Year (October, November, December) is a result of high conception rate during the spring, mainly April through June, and lowest during the summer months.
It is observed that between 1861-1900, the chart shows no sharp dip in birth rate incidence as evident in the charts for 1781-1820 and 1821-1860 respectively.
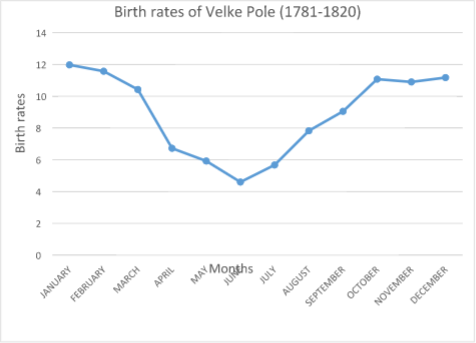 Fig. 1 (above): Birthrate from 1781 to 1820
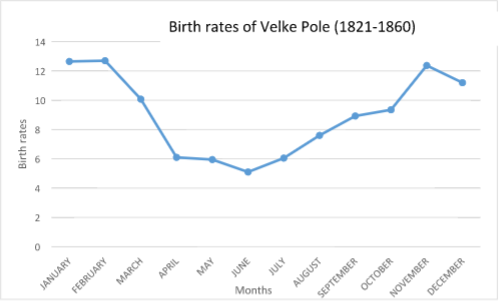 Fig. 2 (above): Birthrate from 1821 to 1860
 Fig. 2 (above): Birthrate from 1861 to 1900
Source: Deepanjana, M.: A study of seasonal patterns of birth for Velke Pole, Slovakia between 1781-1900 (Dissertation, Hochschule Karlsruhe-technik und Wirtschaft, Studiengang Geomatics, 2015).